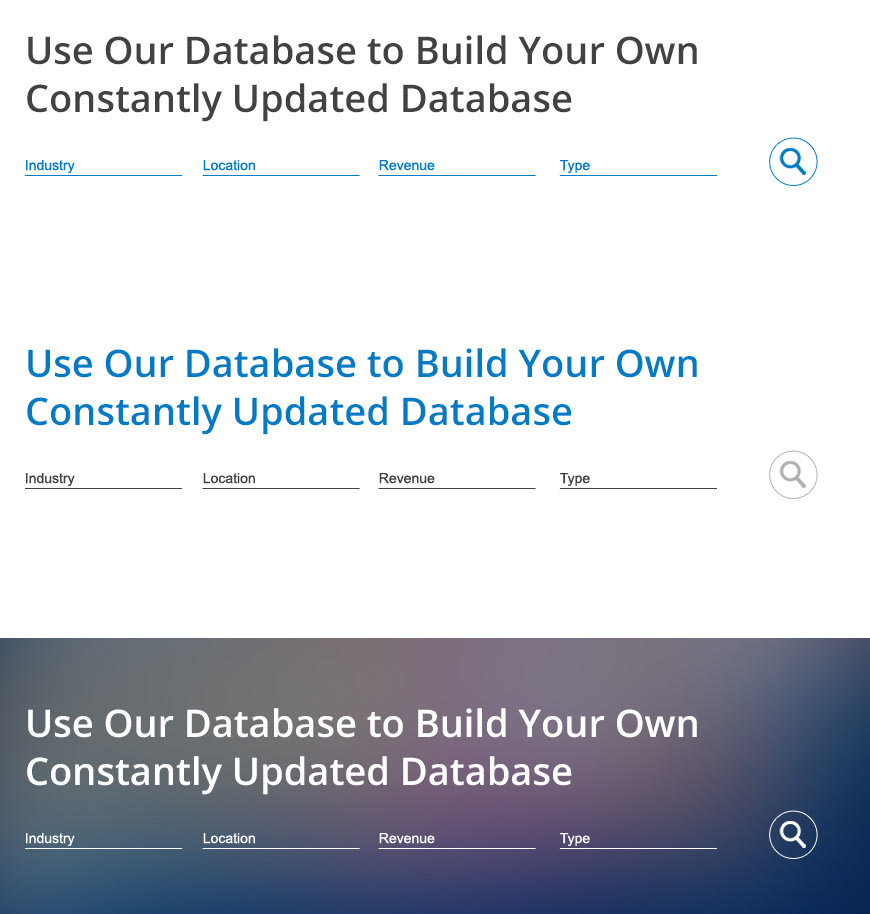
This project is among those I’ve enjoyed the most. I was working with a project manager who was also a wonderful UX expert, someone whom I had a lot to learn from. It was an exhilarating experience, because each of our ideas built upon the other’s, throughout the project. I was given complete creative freedom: I could present any UI idea I envisioned, along with various UX solutions that would serve those ends. Some of those UX solutions were accepted.
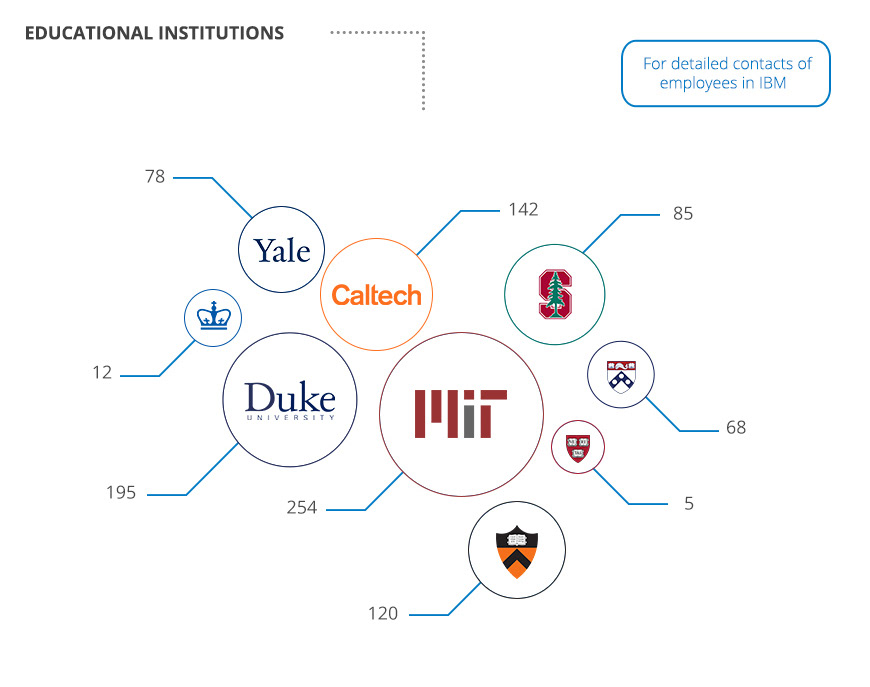
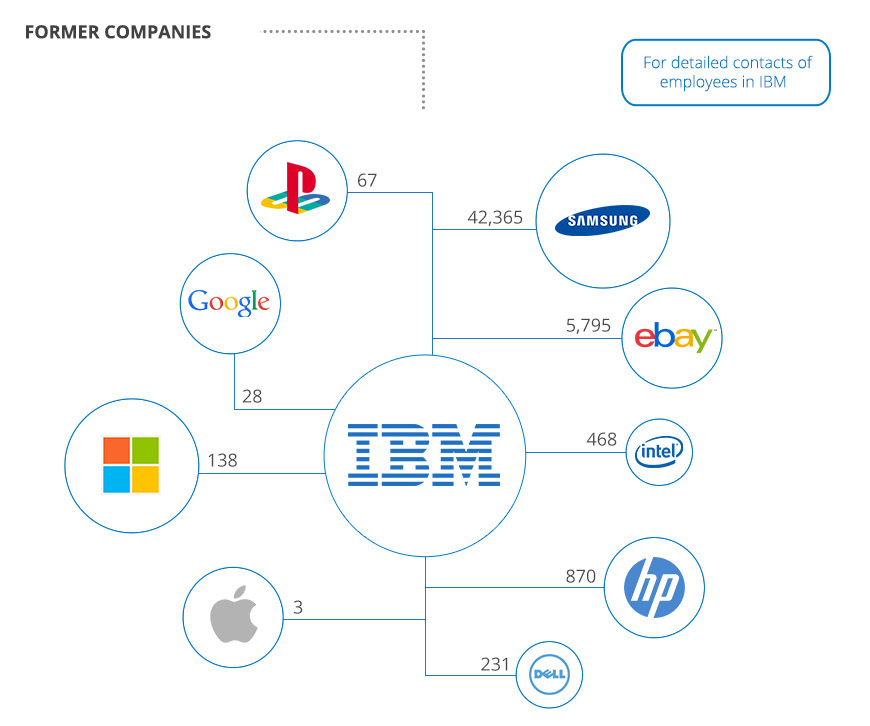
At that time, Business Intelligence (BI) and info-graphics were totally new to me. It was the first project I did in this field, and at first I had no idea how to approach this the problem. Prior to this case, most of my experience had been in UI; with this case, I had no technical restrictions. I was free to underwrite the UI while overlaying the UX, with no limits on my vision. I could choose any graphic object I wanted, design it, and fit it perfectly into the project.
In design school, our teachers say “always open your mind to more possibilities and always assume there 100 more ways to do something right.” Unfortunately, there comes a day when you start feeling too comfortable, start getting bored, and crave to get out of your comfort zone.
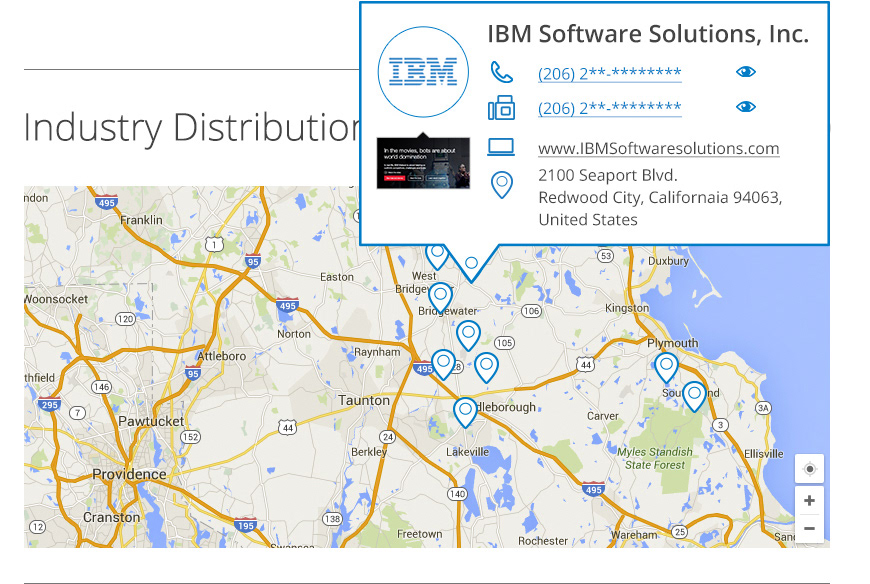
That day arrived without me noticing, and I found myself in that very place; but when I touched the data visualization field I discovered this world of new, beautiful order. While working on this project, the most important thing I learned is that I wasn’t satisfied, and I wanted more.